
Published on
Introduction
In the world of microservices architecture, understanding how a system behaves is crucial. This is especially true for the Addepar Trading solution, where monitoring and understanding business flows, infrastructure, API calls, database interactions and inter-service communications are of paramount importance. Let me take you through the journey of how we tackled these challenges and implemented an effective monitoring solution.
NOTE: The metrics provided in this blog are based on a test/development environment and do not reflect actual production data.
Addepar Trading goals
We had three major goals for our trading solution:
Monitor business flows and raise alerts
Get infrastructure metrics and alerting
Pinpoint exactly where an exception/error has occurred in the system
So, how did we start monitoring the Addepar Trading system?
Initial iteration — monitoring using Grafana and Prometheus
Our initial monitoring setup used Prometheus with Grafana for visualization. This first iteration was a valuable learning experience, allowing us to adapt and improve. Prometheus supports pull-based metrics scraping, custom application metrics and infrastructure metrics scraping with Kubernetes, making it a good starting point.
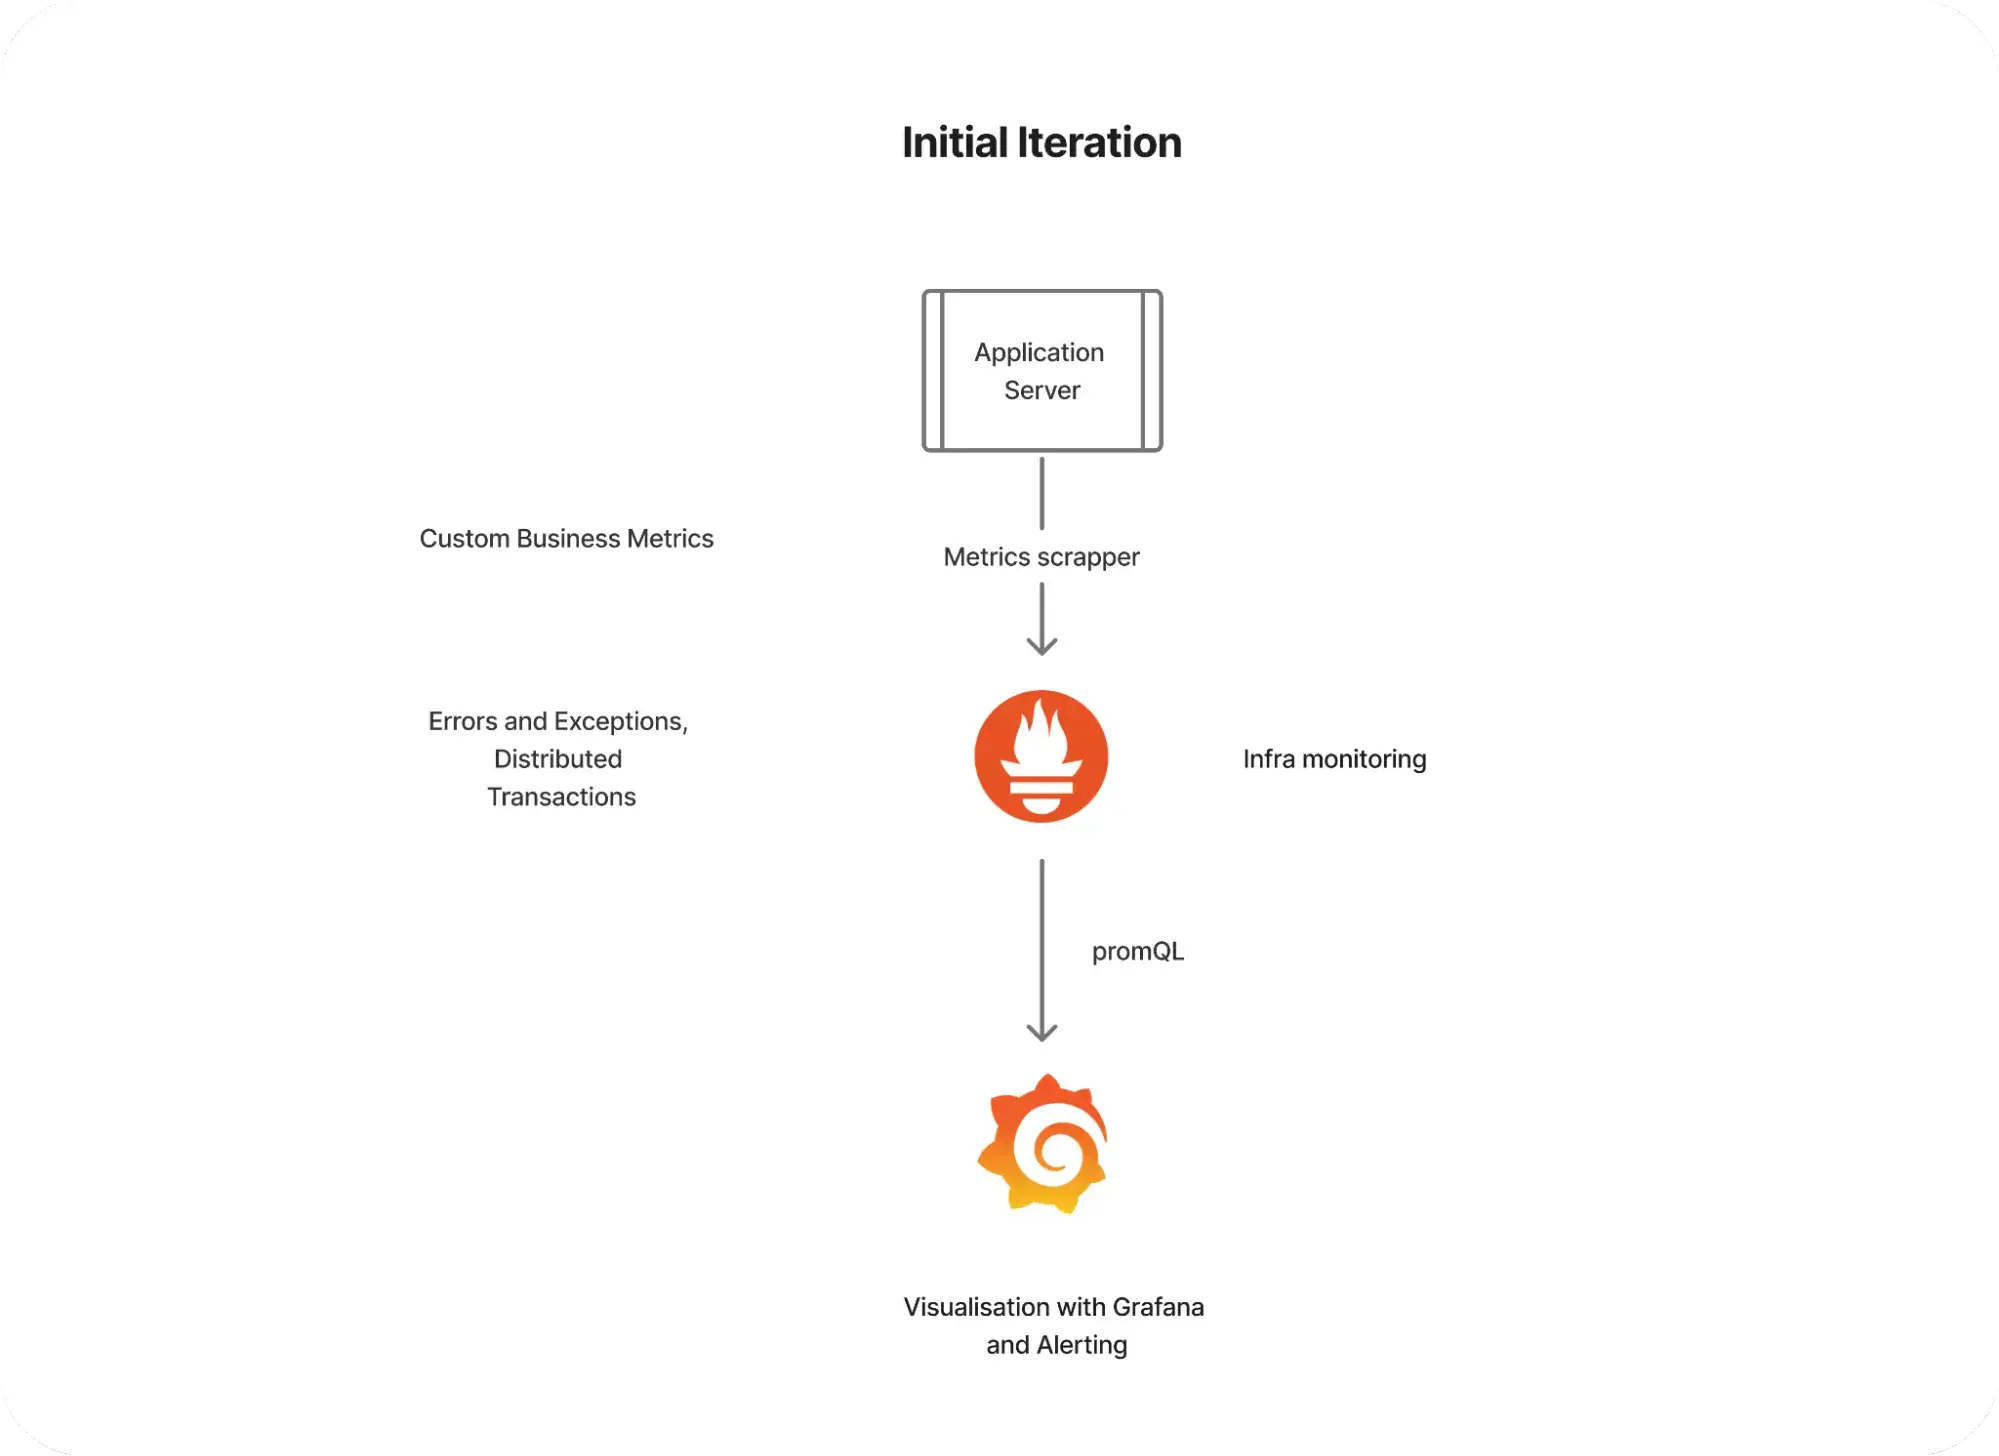
Initial iteration of observability with Prometheus and Grafana
However, we soon ran into several issues:
Redundant metrics scraping if no change in metrics
Uncertainty in custom metrics query results
Tightly coupled with the application with no support for push-based metrics
These challenges provided valuable insights, while Prometheus has its strengths, there are areas we need to improve upon.
Pivot to Sumo Logic
To enhance handling of custom application metrics, we embraced Sumo Logic for business flow metrics. Sumo Logic offered several significant advantages:
Good integration with logging and generating metrics over scraped logs
An excellent way to push metrics with logs and visualize them on Sumo Logic dashboards
Support for alerting on logs, helping in notifying via Slack or PagerDuty
This pivot allowed us to maintain a robust monitoring system while we worked on implementing our long-term solution.
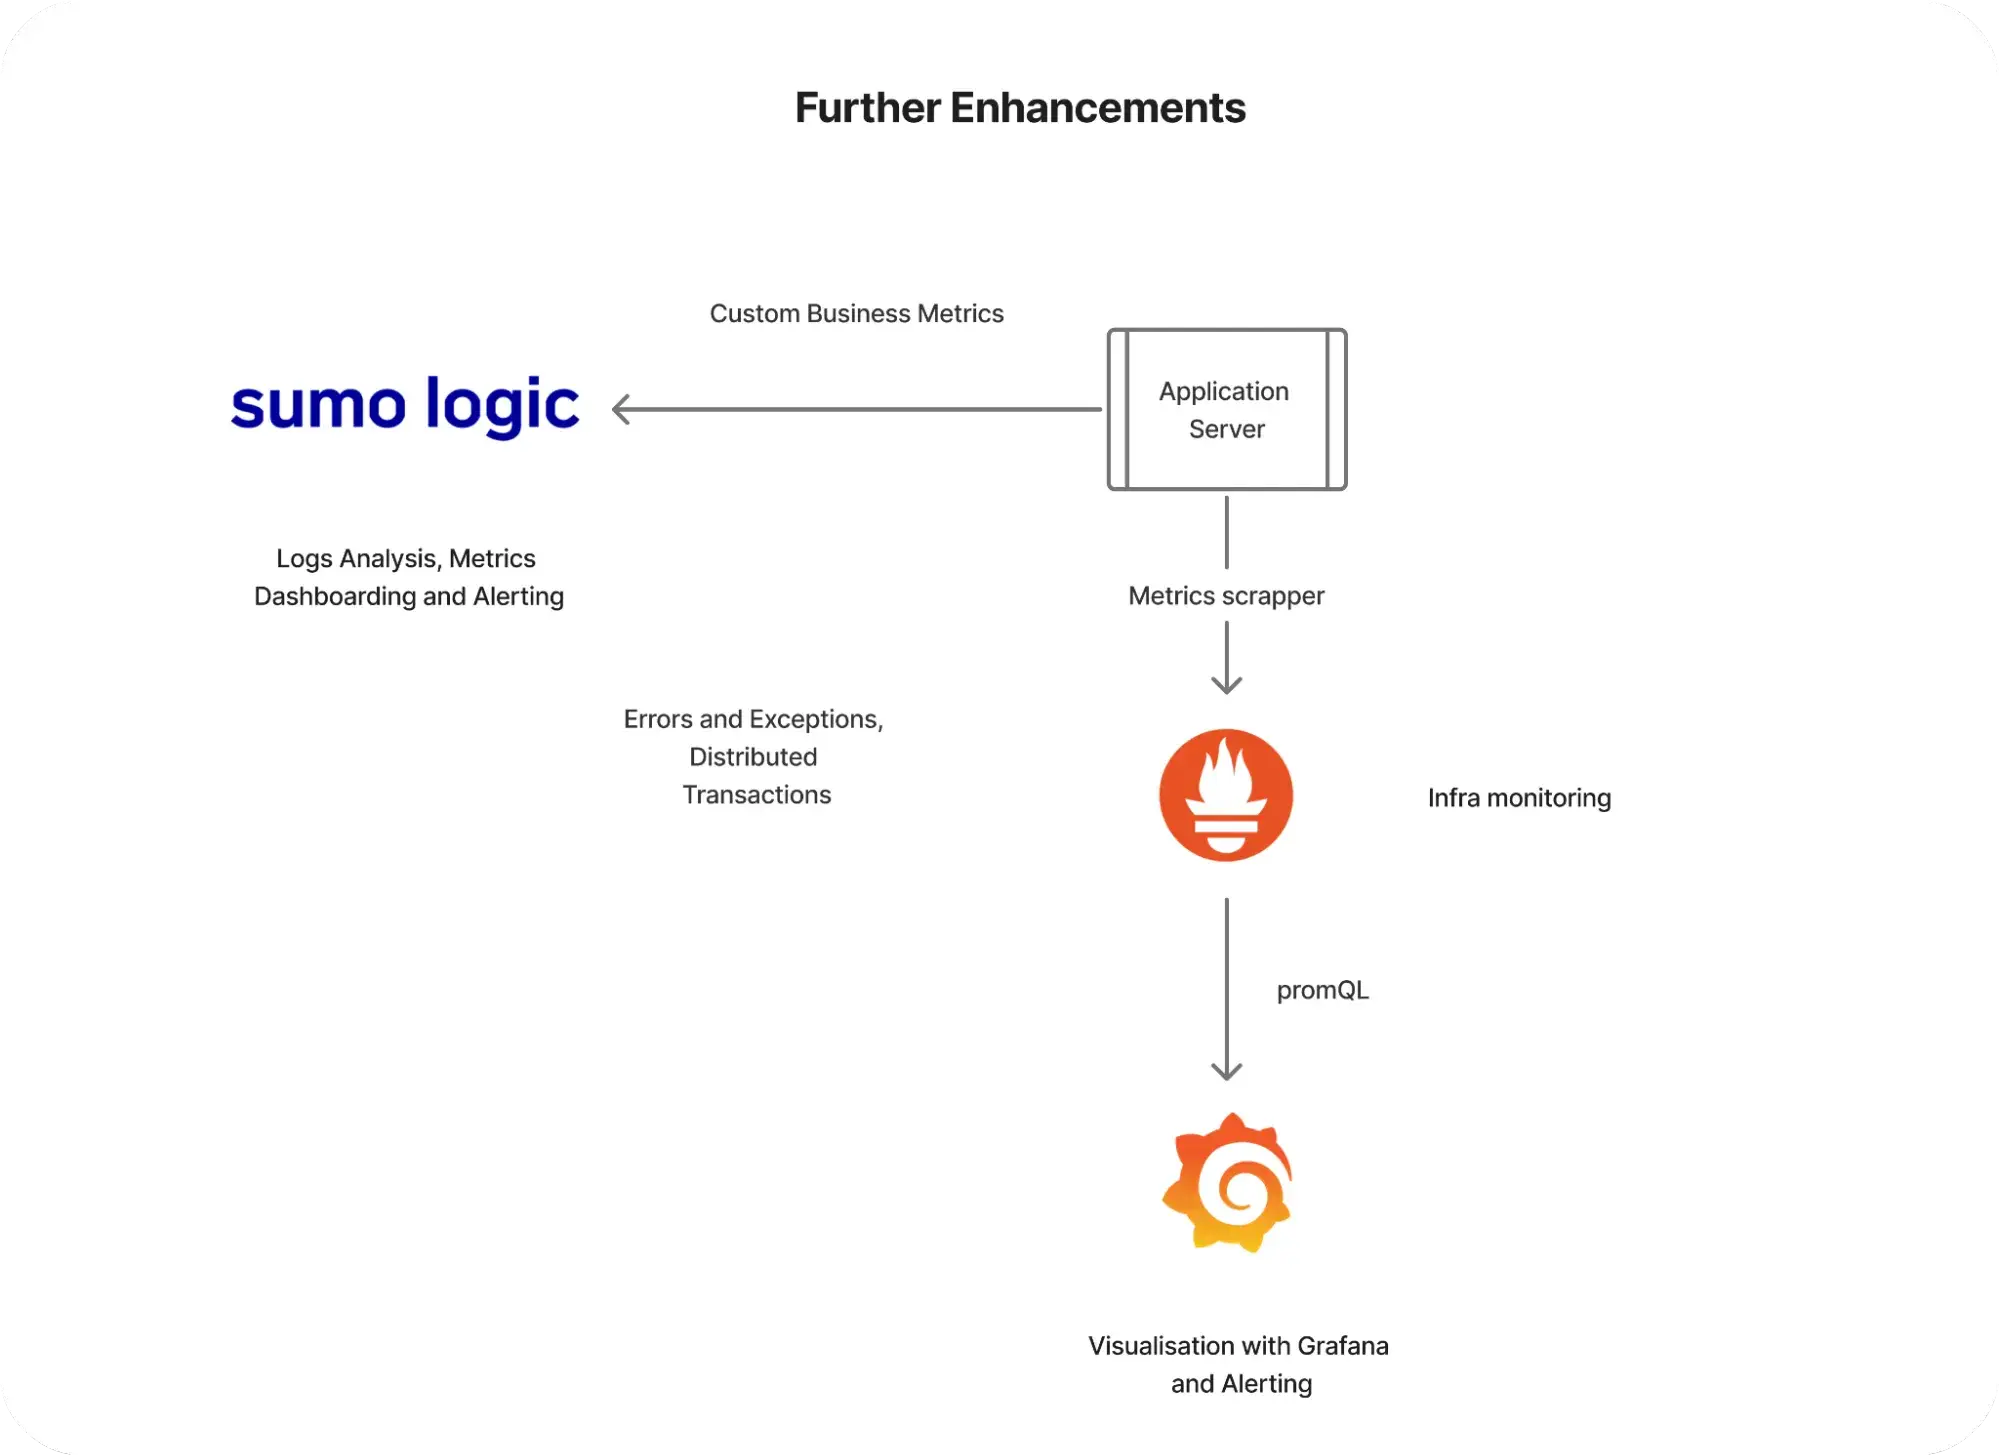
Enhancement with Sumo Logic
How Sumo Logic addresses Prometheus’ challenges
Efficient updates: avoids redundant metrics scraping
Accurate queries: provides reliable custom metrics queries
Push-based support: reduces tight coupling with application
Enhanced integration: integrates better with logging and visualization
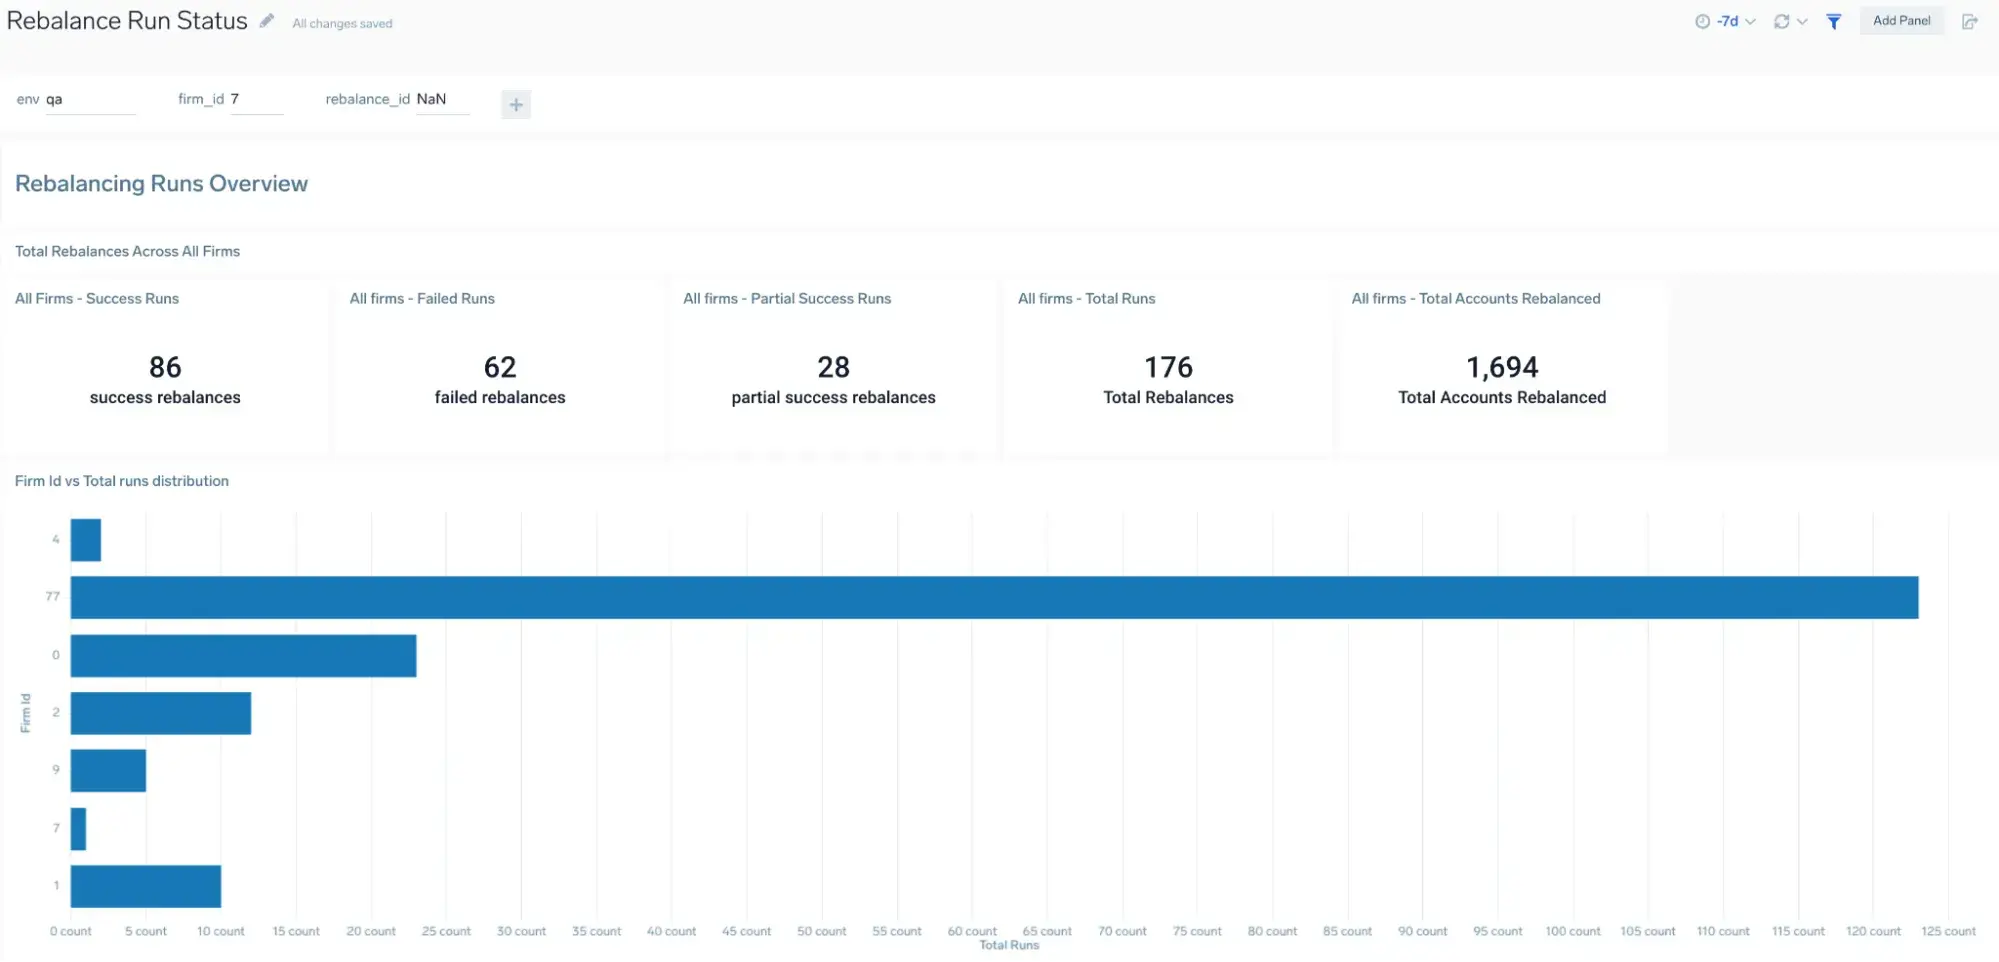
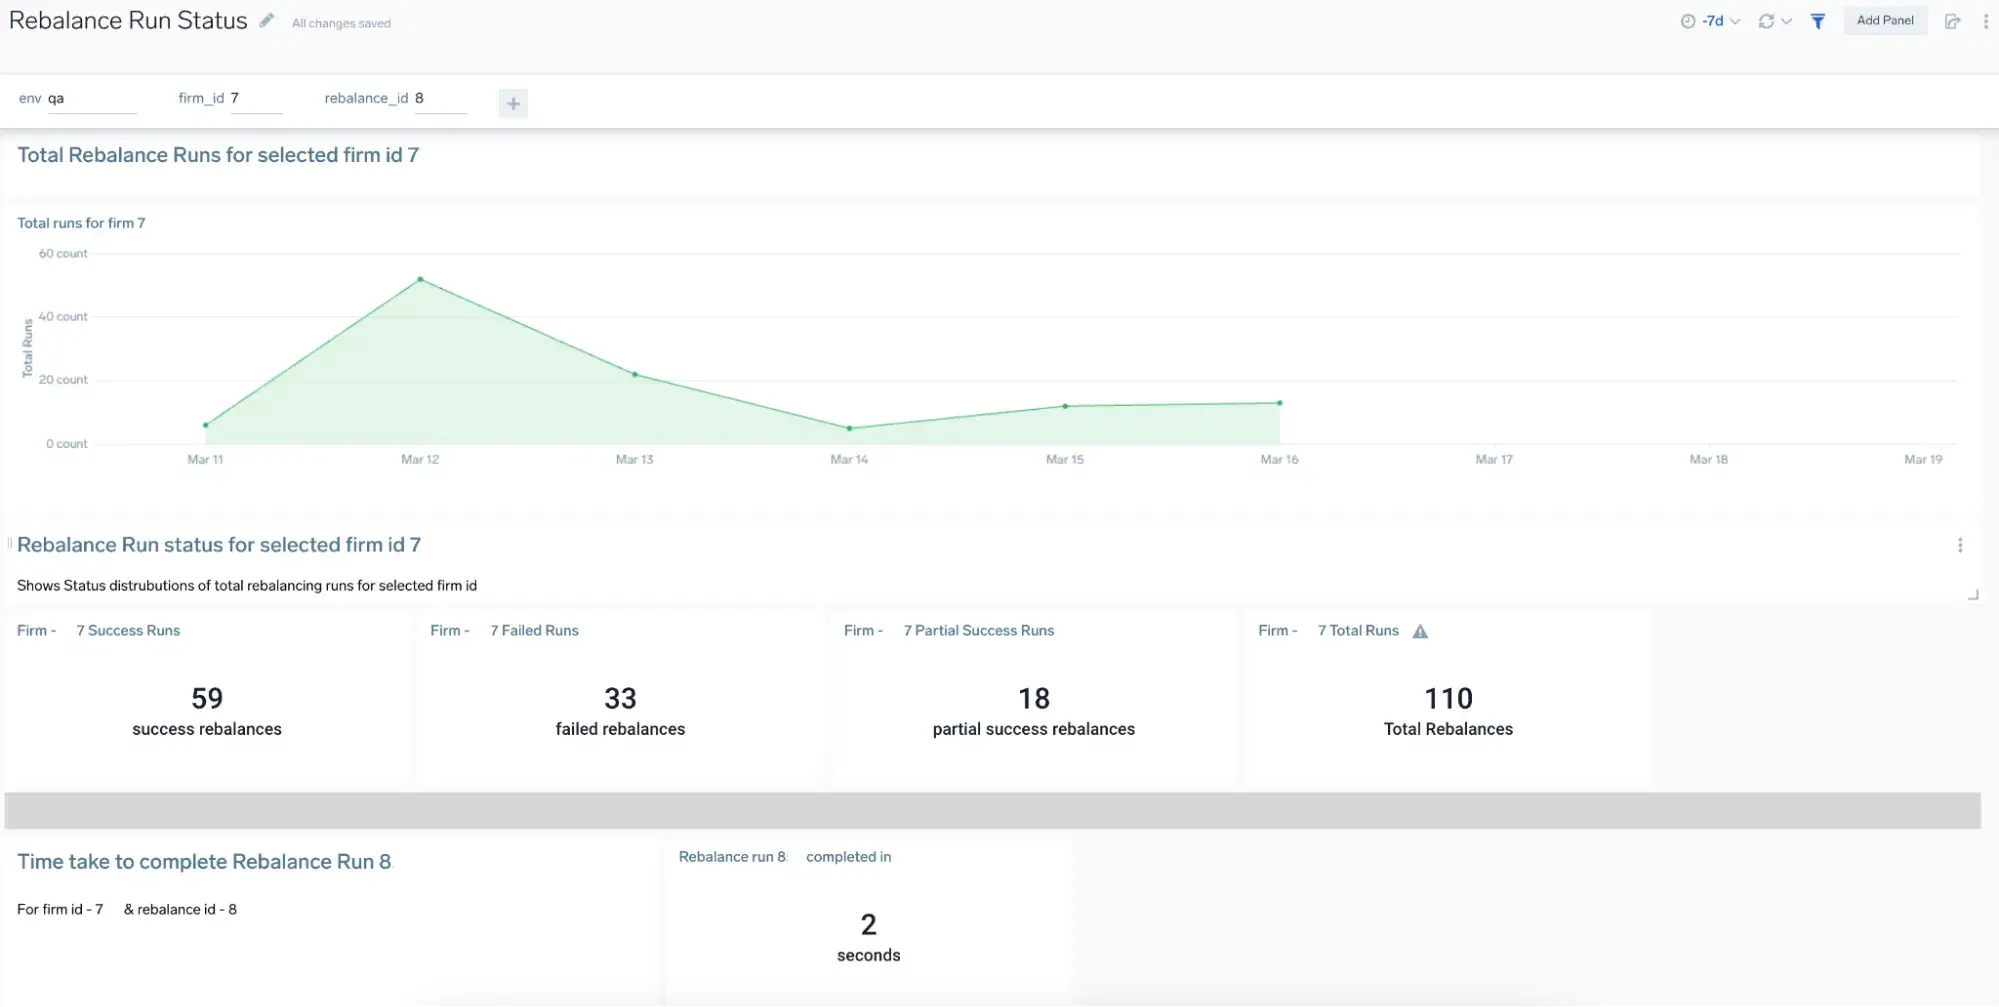
Example of rebalance run metrics in Sumo Logic
What about exceptions and errors?
Another key aspect of application reliability and precision was monitoring application errors.
For this, we used Sentry. Sentry is widely used for front-end applications to monitor performance, exceptions and errors. It also supports backend systems. However, with limited framework support and no direct support for auto-instrumentation in Quarkus.
We implemented custom Sentry tracing for APIs, Kafka and DB Transactions. With Sentry, we were able to capture:
Performance metrics
Exceptions and errors
Distributed transaction tracing
Alerting to Slack and PagerDuty
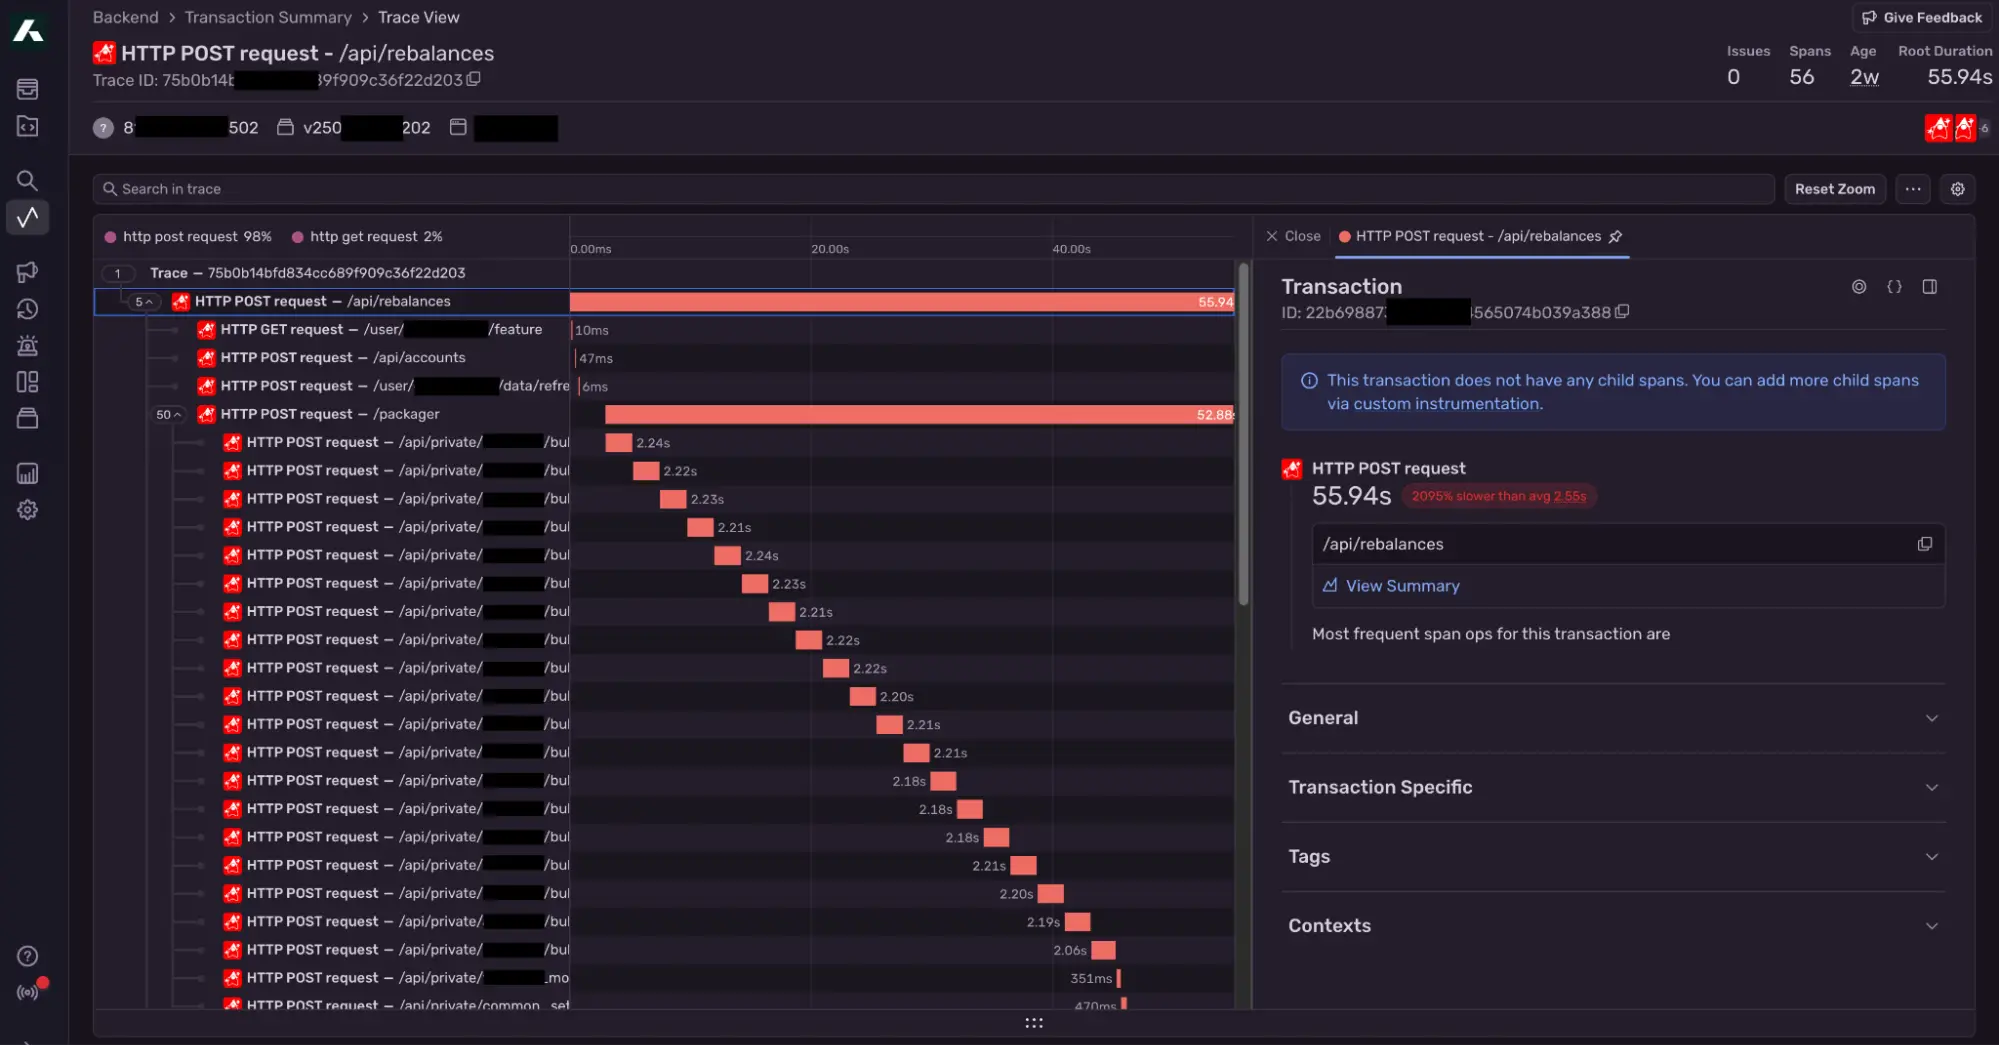
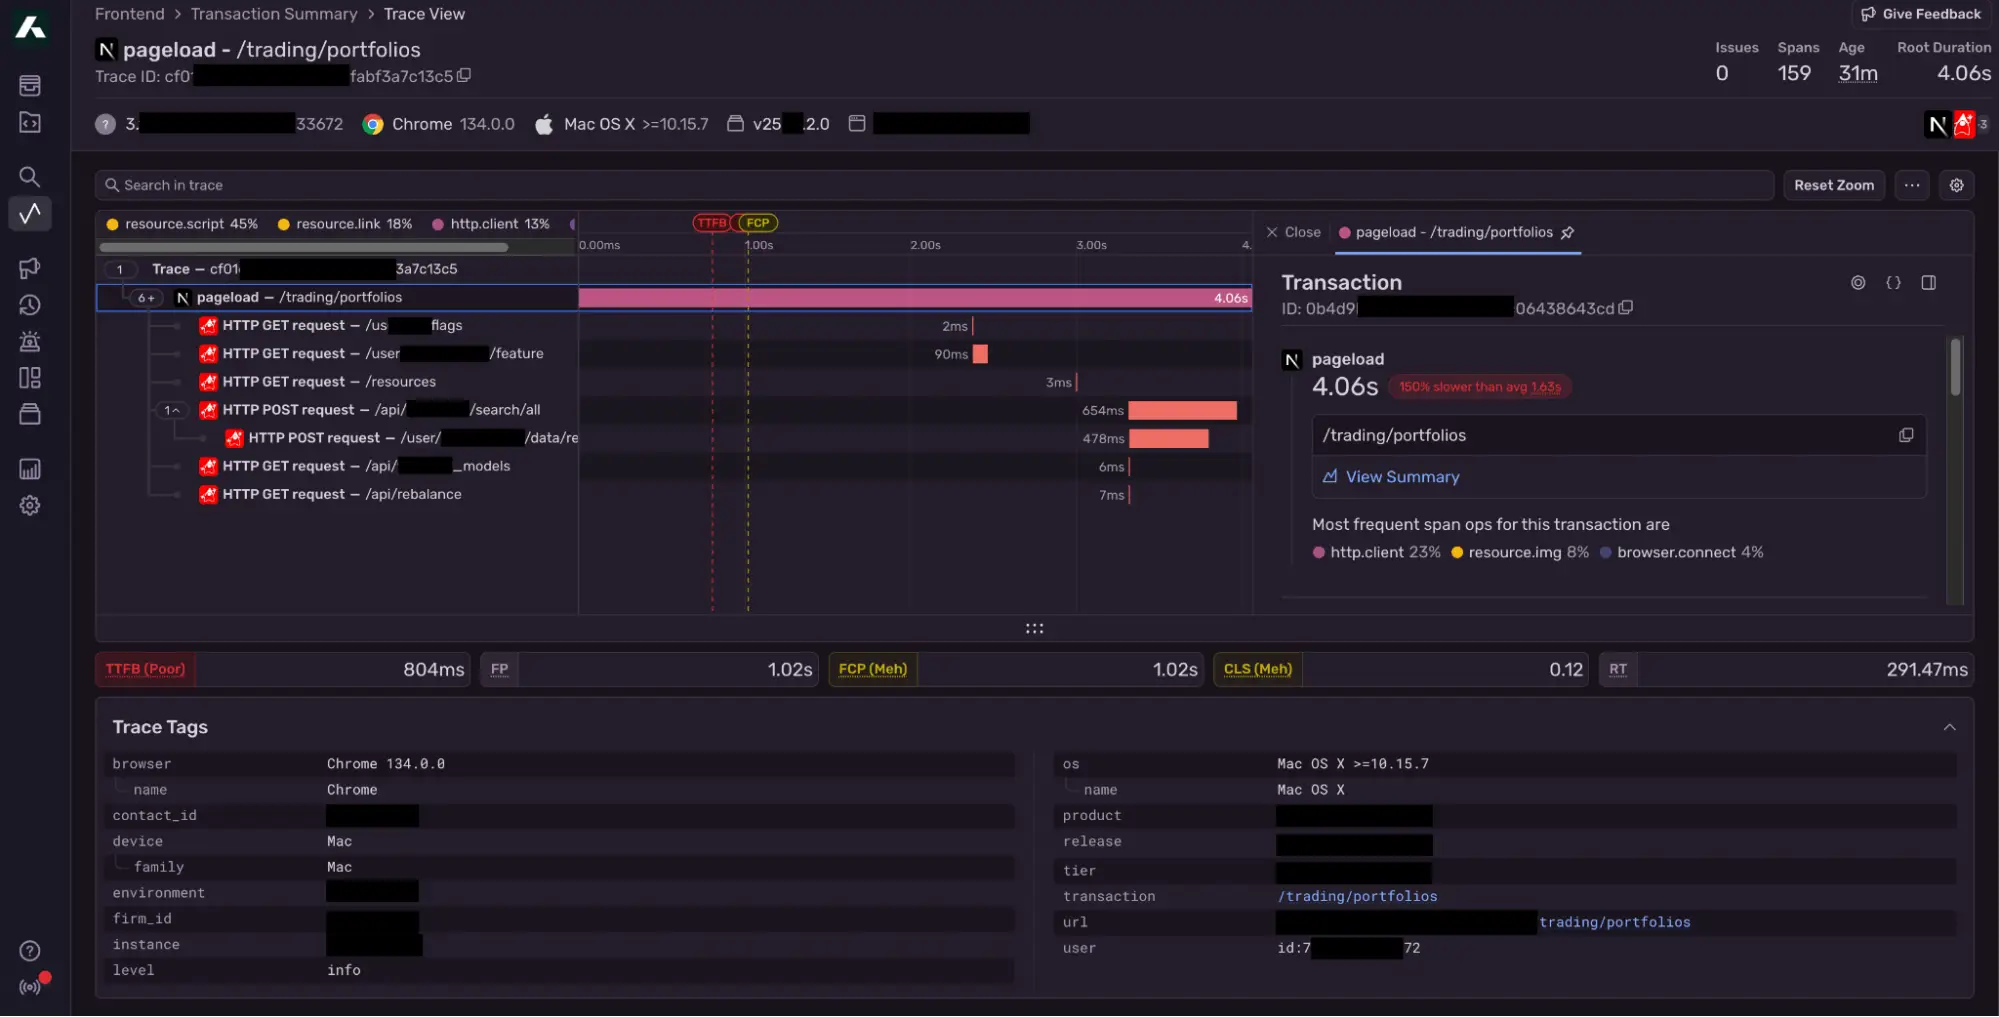
Sentry metrics for UI and back-end service
Prometheus is still useful
Prometheus also proved to be useful for infrastructure monitoring. When paired with Grafana, it excelled at providing great visualization and alerting for infrastructure components, such as:
CPU and memory metrics
Kafka topic consumption metrics
JVM metrics
HTTP status code and response time metrics
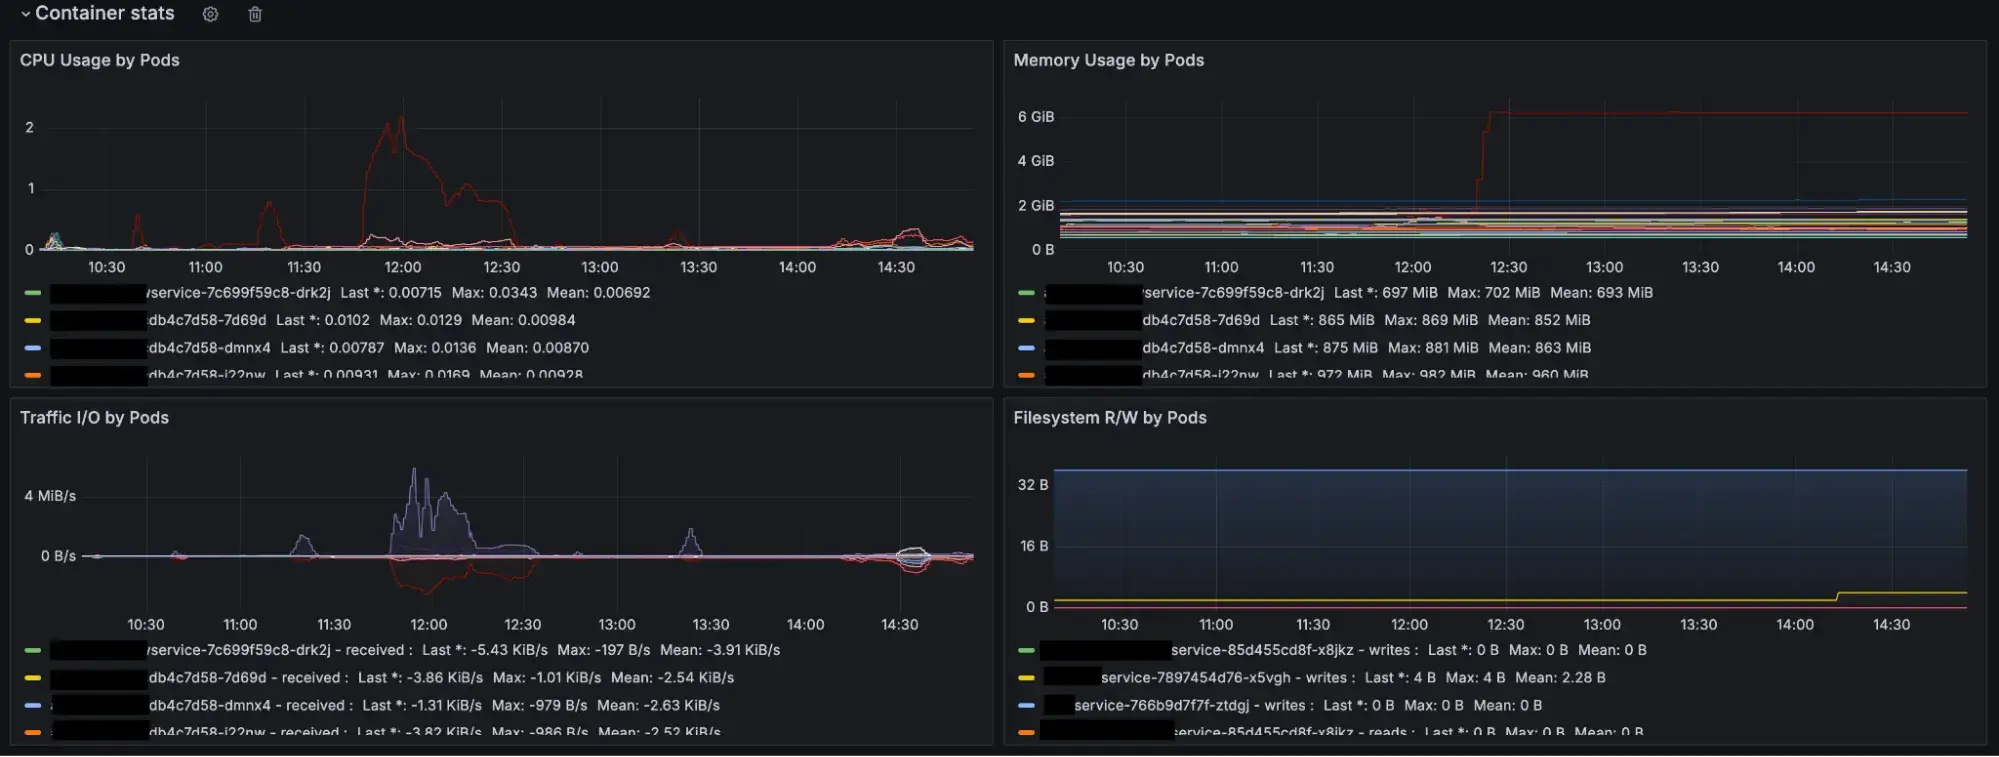
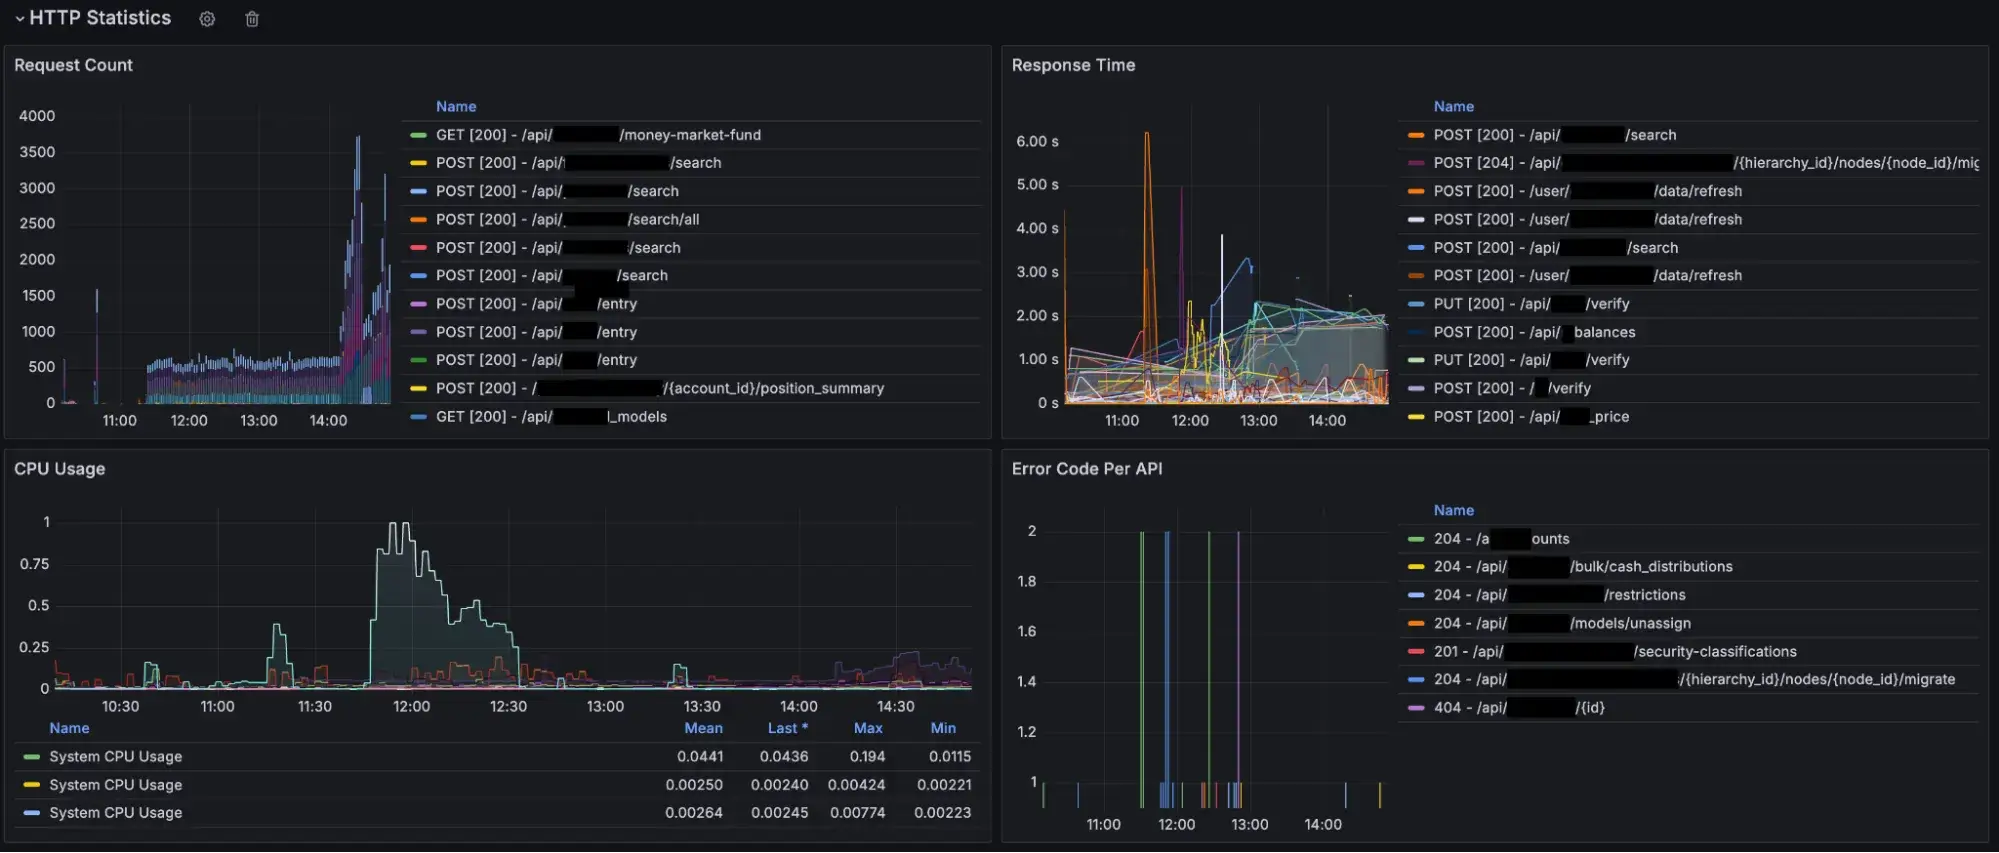
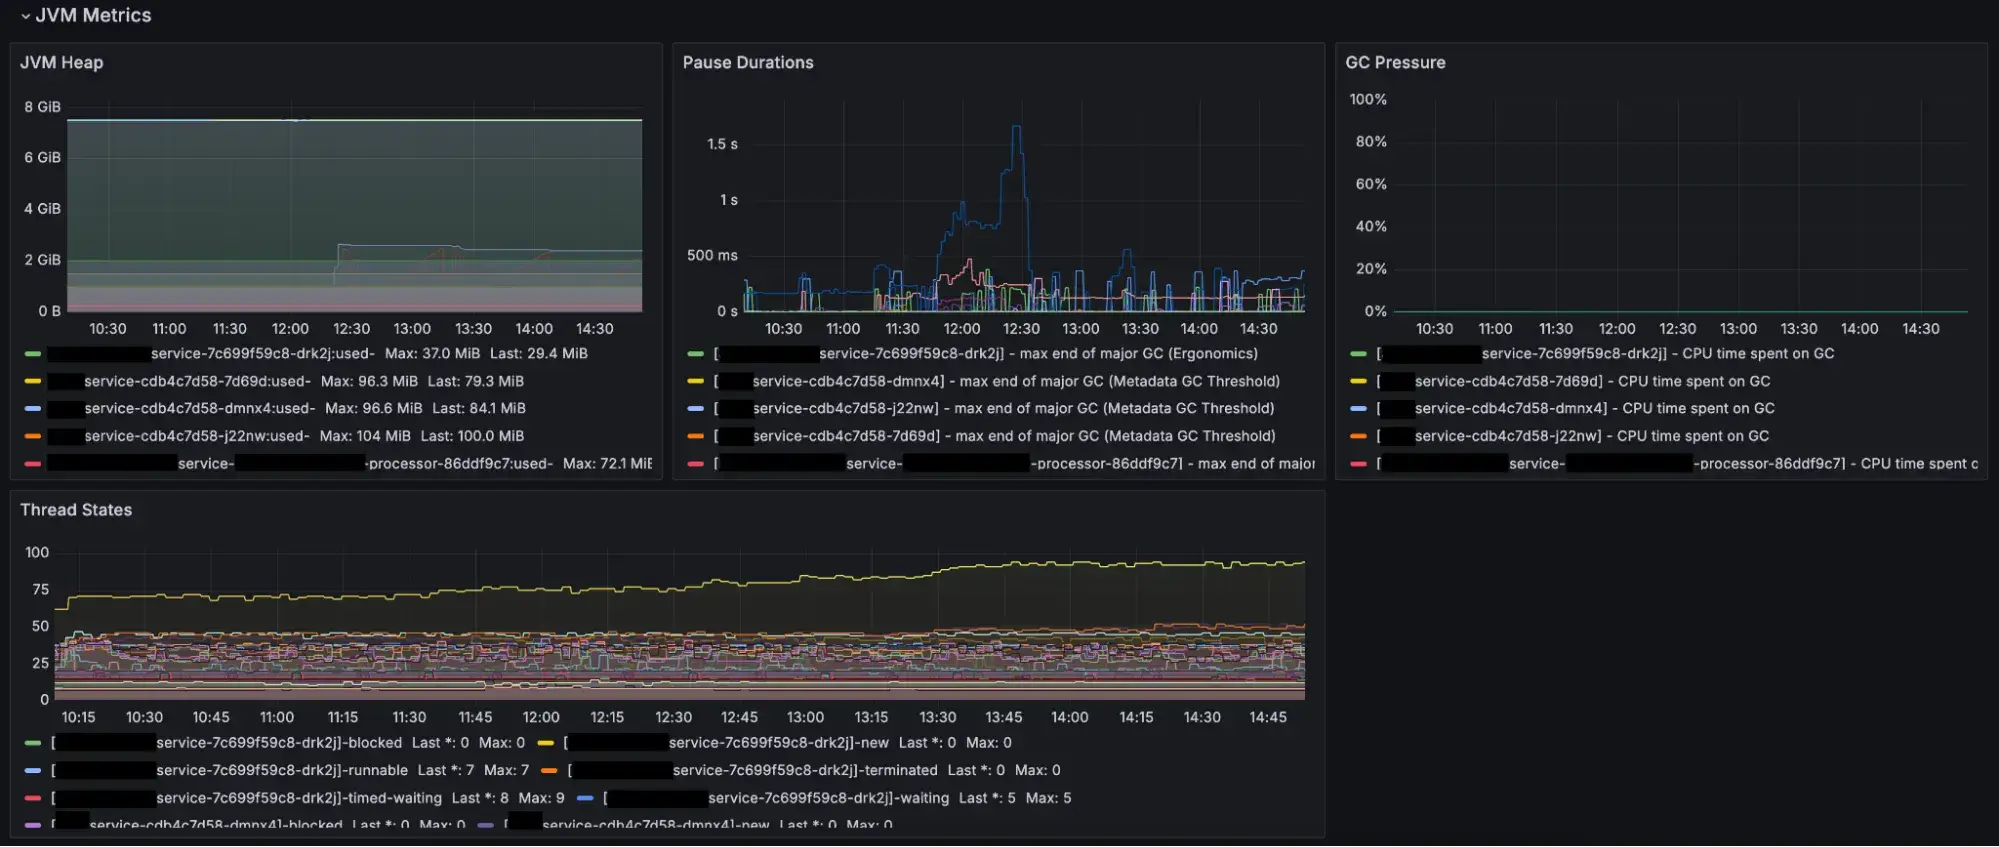
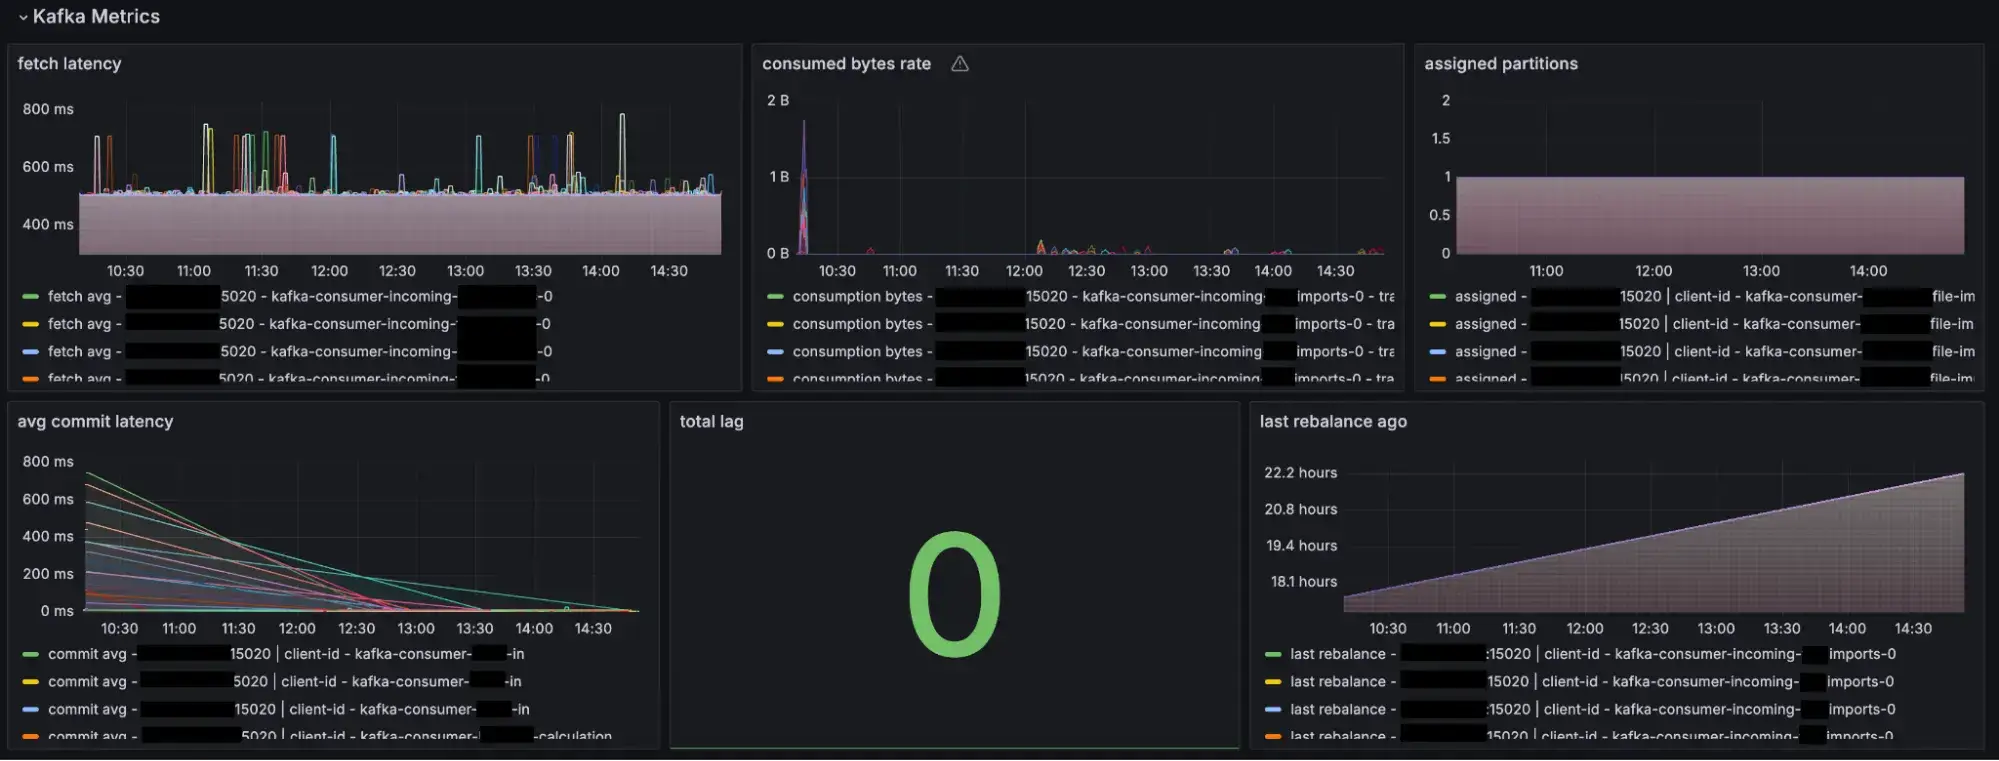
Grafana Metrics for Http, JVM, Container and Kafka
Prometheus and Grafana were thus retained for infrastructure monitoring.
Benefits and long-term vision
At first glance, it might seem like we have multiple tools doing similar things. However, each tool has its unique strengths and purposes:
High availability in the monitoring solution: If one system has issues, another system may still catch the problem.
More insights: Multiple tools provide a richer set of data and insights and more granular metrics collection.
Our long-term vision is to reduce the monitoring solution to a maximum of two tools that support all the requirements of functional and non-functional metric collections and alerting. This will simplify our monitoring landscape while ensuring comprehensive coverage.
Summary
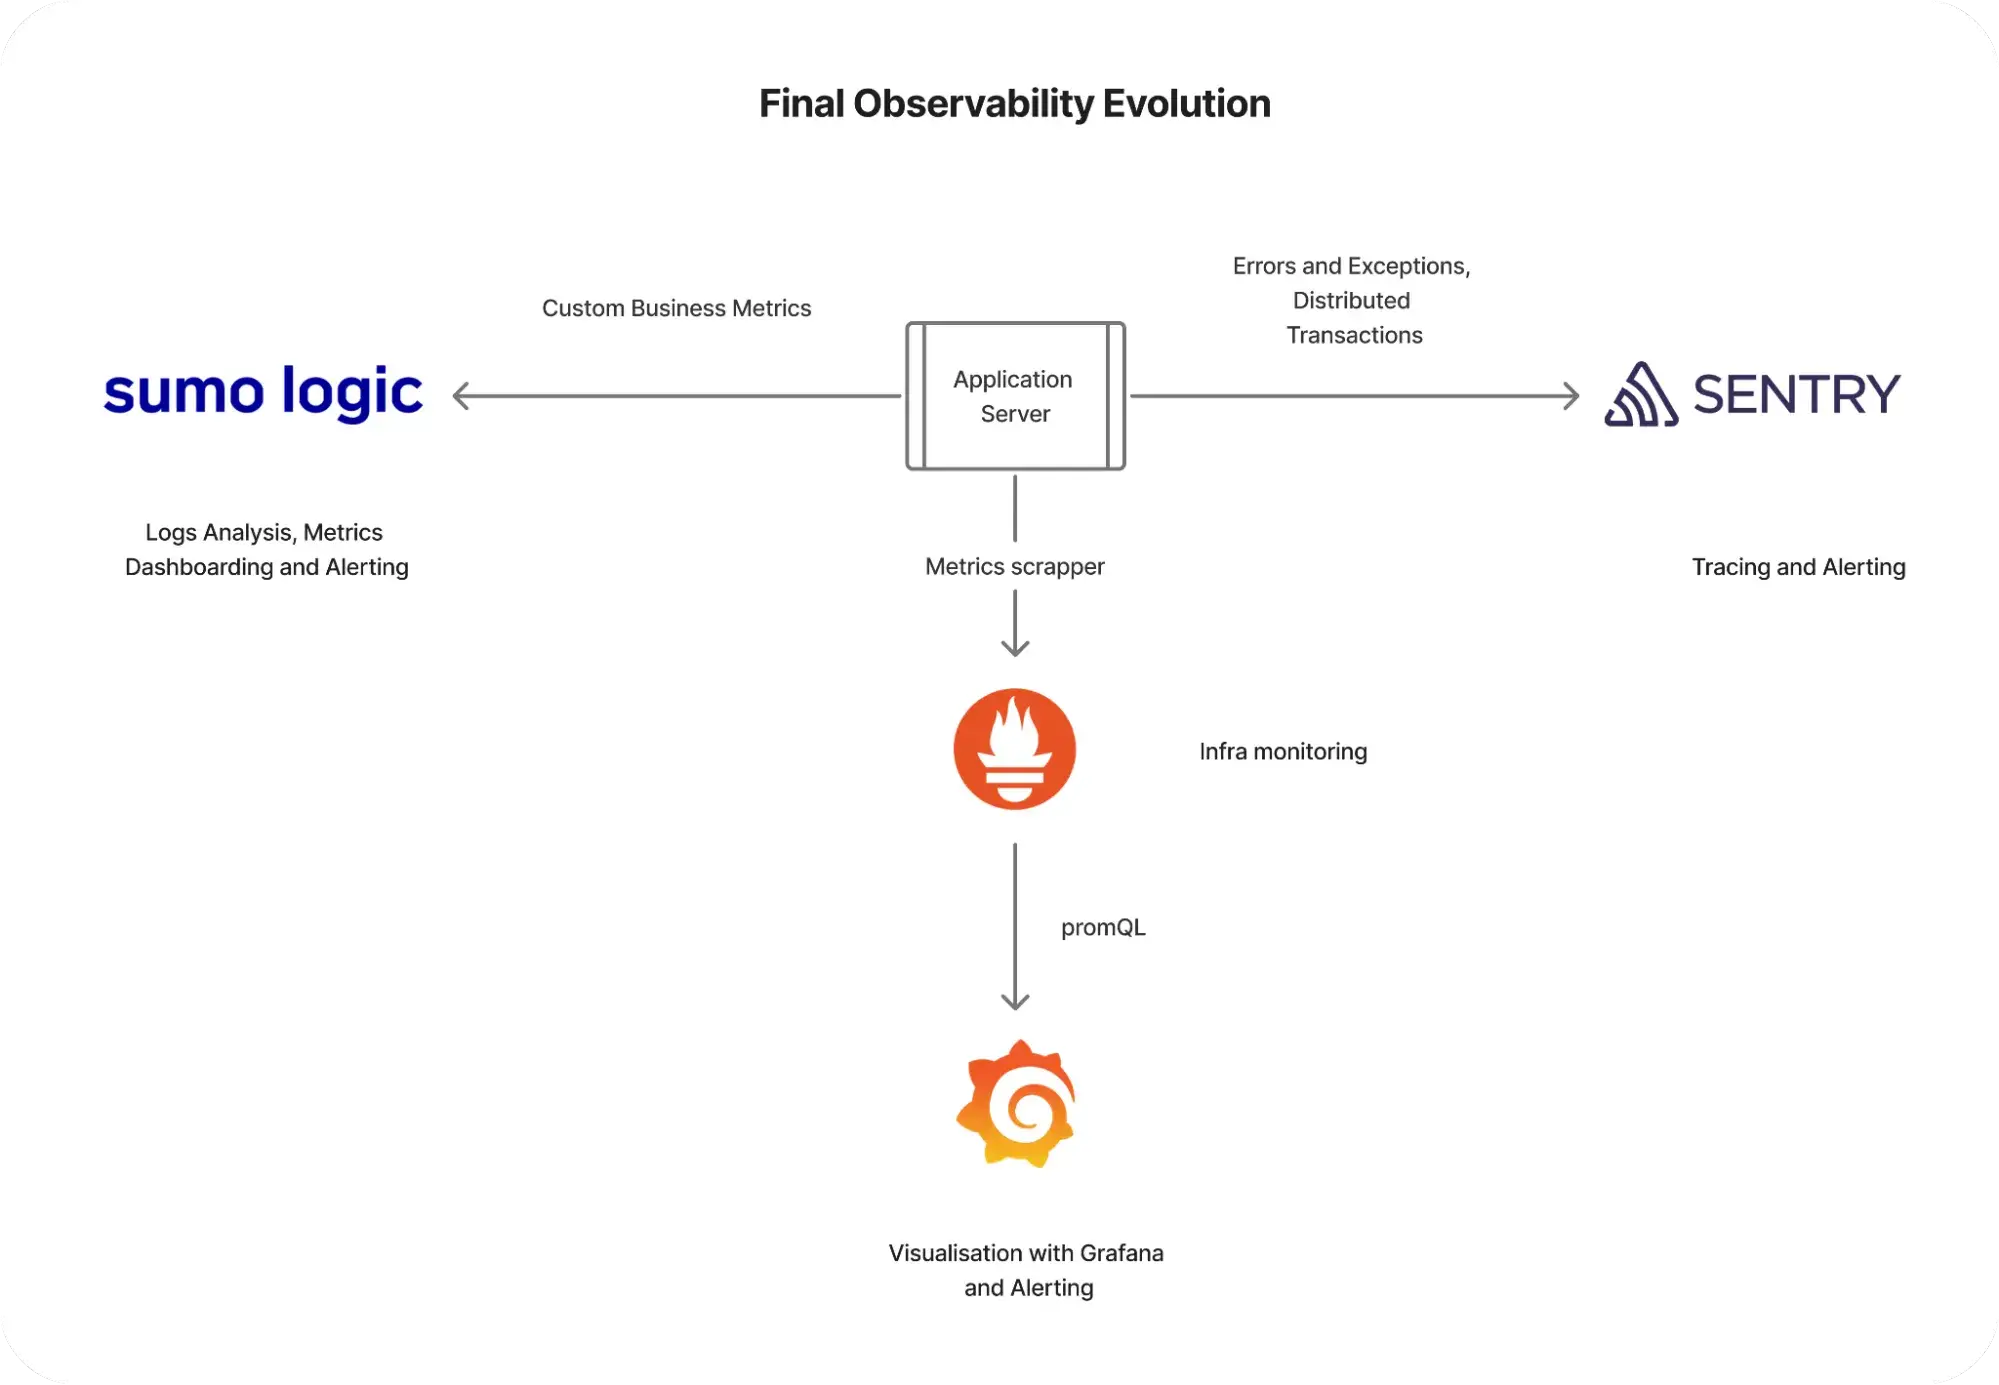
Final observability evolution in Addepar Trading
In conclusion, the journey of implementing a robust monitoring solution for our trading solution has been a learning experience. By leveraging the strengths of multiple tools and continuously refining our approach, we have built a system that meets our monitoring needs effectively.
Next steps
As we continue to innovate and pursue our goals of achieving the best possible solutions, we are exploring new monitoring tools to provide a more sustainable and long-term approach. This exploration is driven by our commitment to continuous improvement and excellence.