
Published on
Author’s Note: This was originally posted in 2017, and nearly all of its content holds true today. The Financial Graph remains a foundational model for Addepar, giving us the ability to analyze portfolios from a configurable starting point, and allowing us to model the consequences of complex ownership relationships. It has been instrumental to building newer features such as our Billing and Portfolio Rebalancing modules. As our platform has evolved, we have considered the ways in which financial graph data integrates with other data throughout our data platform. Not every consumer necessarily models or cares about the full resolution of the financial graph, and it has been interesting to explore less precise representations that fit the more traditional tabular model. The financial graph continues to be an important component at the core of Addepar’s products and platform.
Addepar’s platform consumes not only financial instruments and holdings (such as stocks, bonds and alternative investments), but the accounts that custody those holdings, the asset owners themselves, and any legal entities that exist in the real world. Together, these entities and the ownership relationships between them make up what we call the Financial Graph. In this blog post, I’ll talk about the benefits of modeling the Financial Graph, some of its challenges and future directions for the model.
Choosing the Graph
One of our first modeling decisions was whether we should model asset structures in a traditional flat, tabular structure (think of the good old balance sheet and Excel), or whether we should try to incorporate real world ownership structure and asset owners, despite the extra level of complexity. Ultimately, we chose the latter because of the added flexibility and modeling power it gave us. Additionally, our team has been able to use some clever approaches to mitigate the complexity of this fully graph-based system and unlock its power.
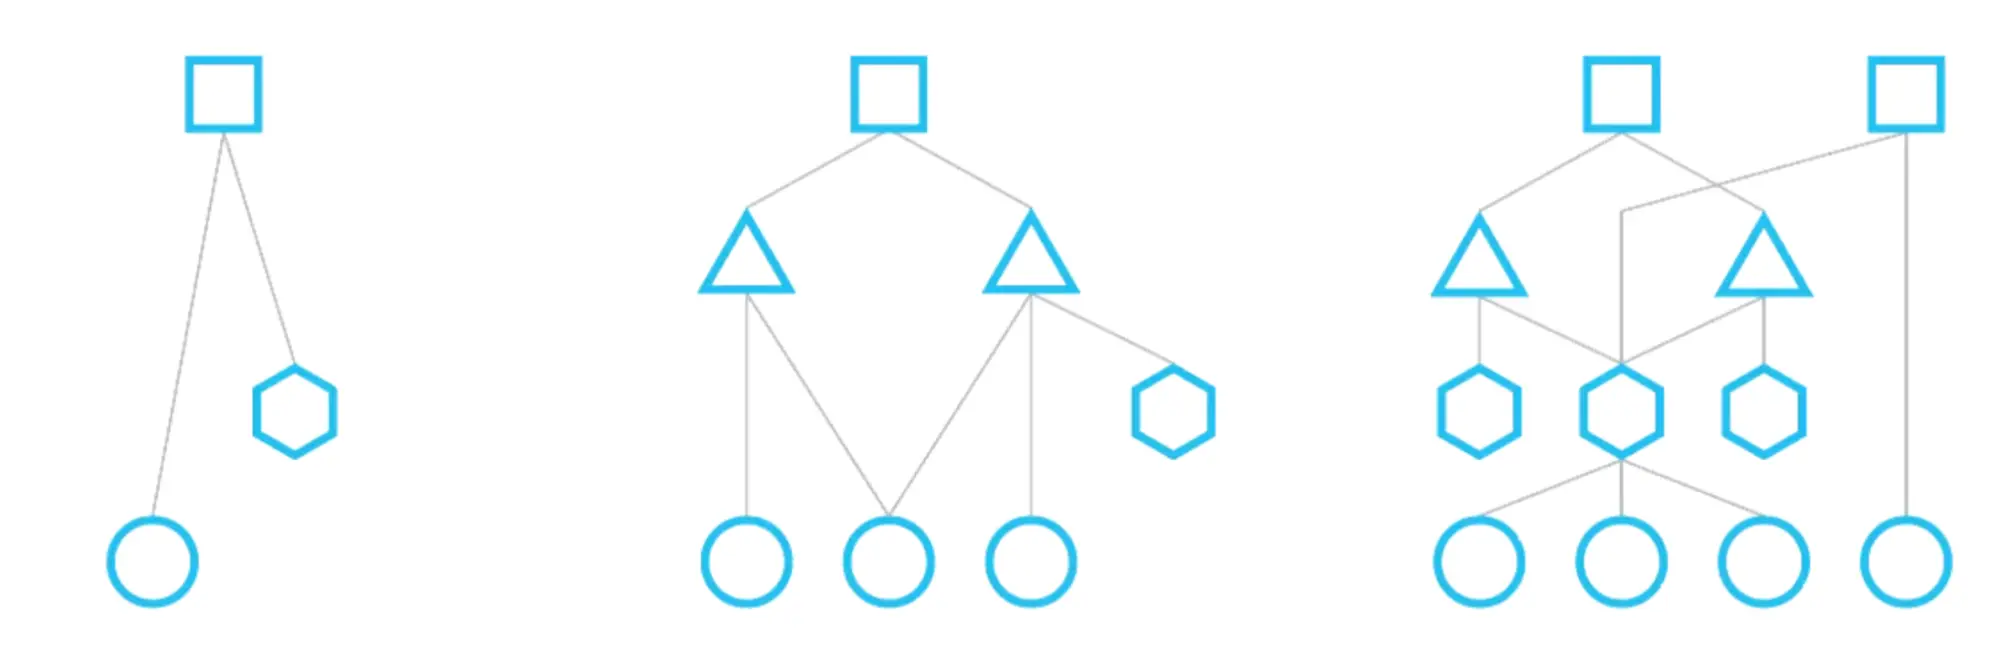
In the Financial Graph, nodes are financial entities (asset owners, accounts, legal entities, securities), and edges are the ownership relationships between them, along with the corresponding metadata. A traditional tabular system would only capture one level at a time, i.e. the leaf nodes and their incoming edges. Modeling the Graph allows us to be compatible with this system, if need be, by entering the appropriate bottom-level information. However, there are a number of advantages to mapping out the rest of the Graph:
Modeling ownership structures allows us to compute the most accurate possible representation of a person’s holdings, taking into account direct and indirect ownership percentages.
Specific asset owners and legal entities in the graph can act as customizable starting points for analysis. In this case, the reachable parts of the graph from this starting point are the inputs for computation. This enables users to seamlessly alter their “perspective” of their data, moving from asset owners to accounts, or any other node in the graph, and still do the same analysis.
By enumerating incoming edges to a fund, contributions and distributions can be easily tracked. Reverse traversals allow us to answer questions about who owns what.
You can choose to view more complex instruments, such as funds, as a singular asset or as a combination of its underlying holdings by exploring the outgoing edges.
Challenges
The features above don’t come for free. The Financial Graph is an entire additional dataset, orthogonal to the holdings data reported by financial custodians, and poses a new set of challenges. We can categorize these challenges into UX challenges (i.e., how users understand and manipulate this data) and computational challenges.
For an end user, the Financial Graph may seem like an unnecessary level of abstraction, but understanding how it works helps them better understand how their data is connected. For example, being fully aware of the consequences of an ownership transfer in the upper parts of the graph might be a non-trivial challenge and requires expertise with the concept.
We’ve found that modeling different user personas has helped us address this issue. For example, some users may only use Addepar in an operational capacity — generating reports and analyzing a fixed set of views. Through a detailed and granular permissions system, we can enable these users to do their work without exposing too much additional functionality. On the other hand, data onboarding specialists or more technical users might care more about manipulating and configuring their data, including their graph structure; these users have access to the full set of tools (and APIs).
On the computational side, we’ve had to figure out how our novel, graph-based data fits into the traditional models of financial analysis and calculation. These calculations, such as Internal Rate of Return, operate on line items, rather than a graph. Rather than redefining hundreds of calculations to operate on a graph data structure, our approach here was to convert the graph into something more like line items. This is where Paths come in.
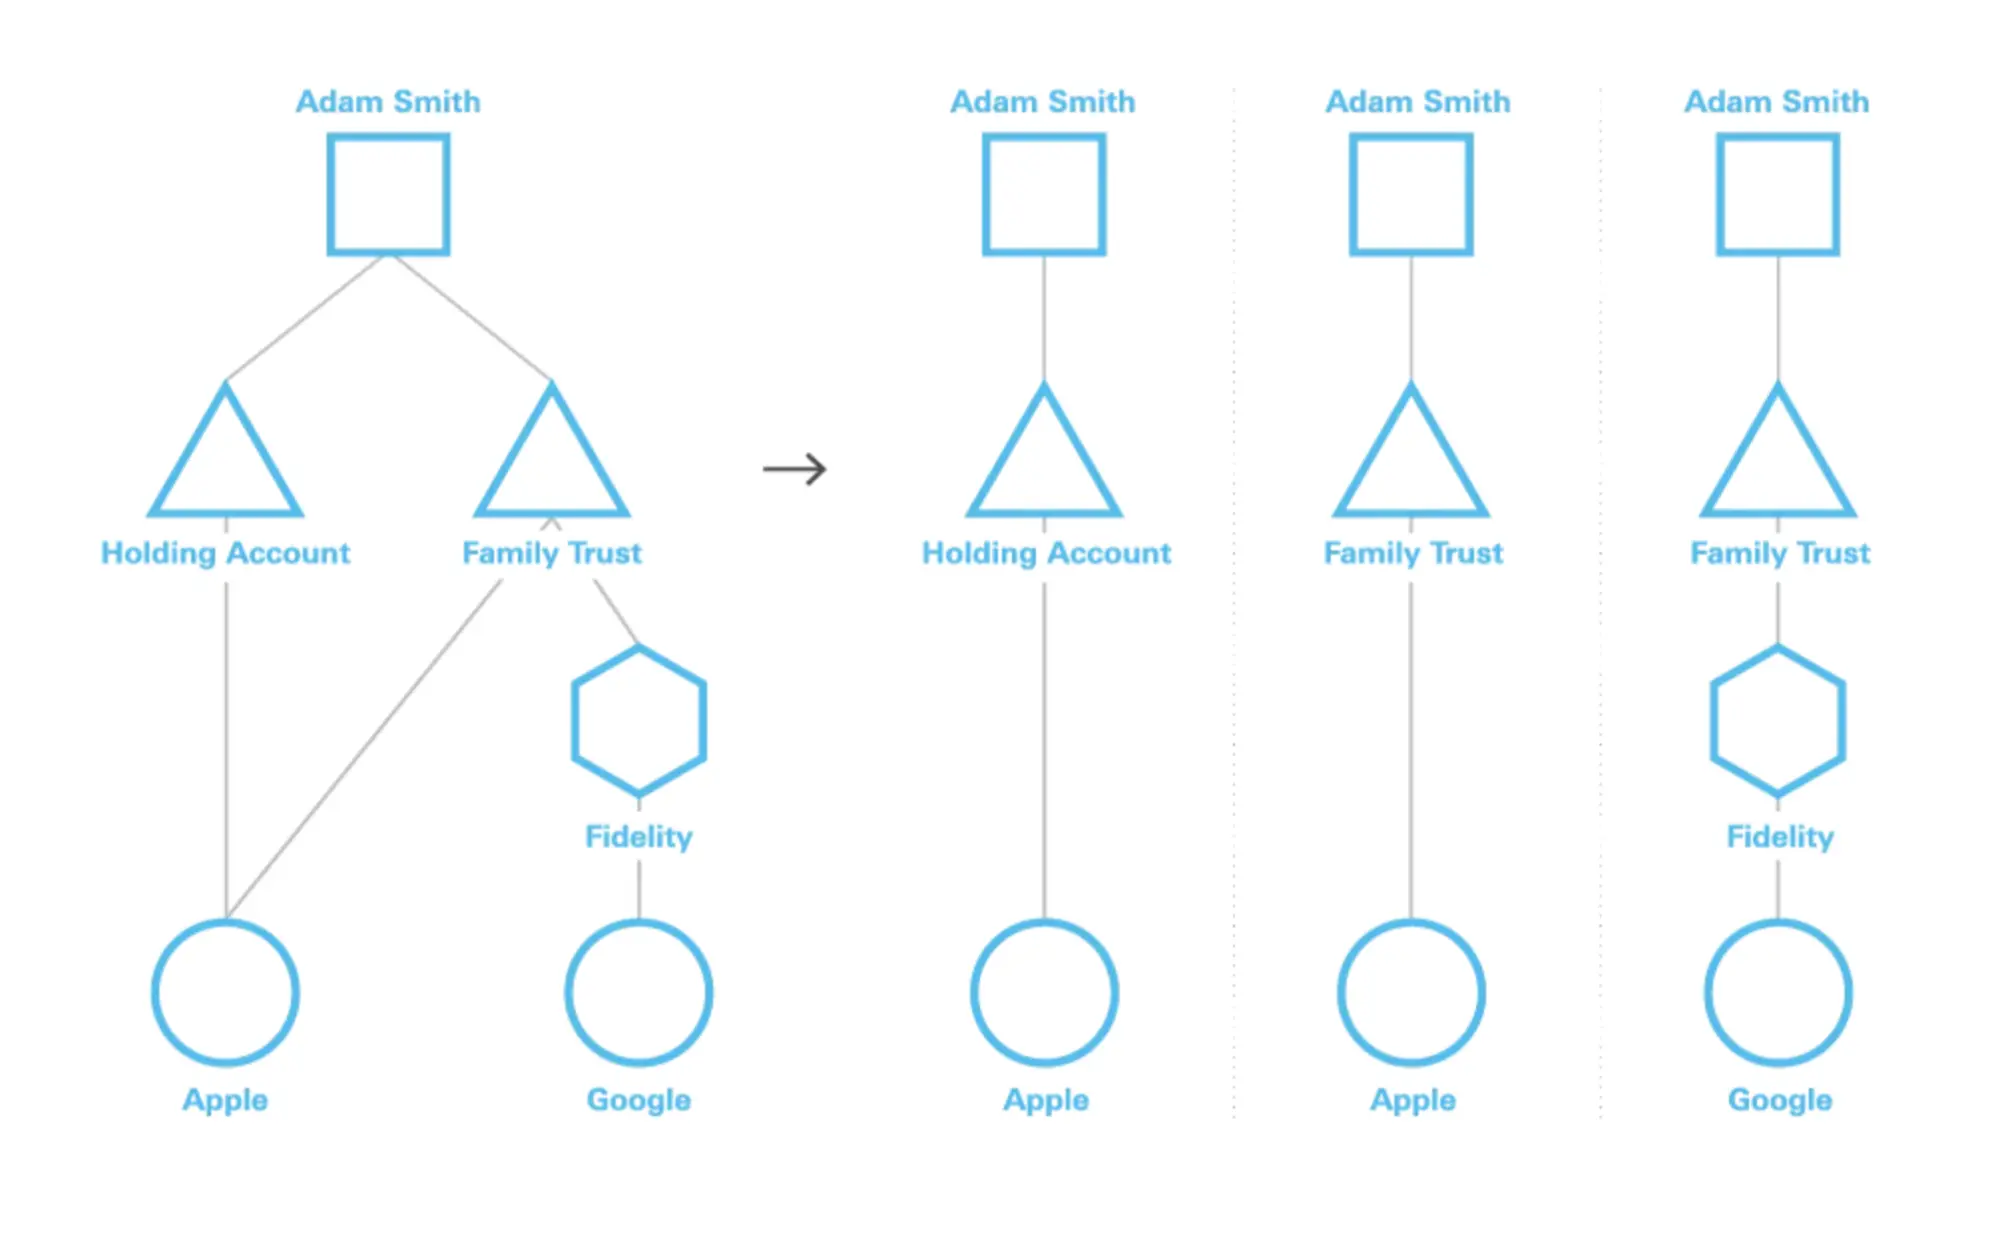
Breaking up a simple ownership structure into paths
Given an Ownership Graph, we derive a set of line items by considering all possible paths through the graph. The resulting dataset, a collection of paths, considers both the bottom level holdings and their incoming ownership information. Our library of calculations is defined on these paths. This approach allows us to decouple the Ownership Graph from the rest of the calculation system. Compared with a graph, paths are easy to compute on, easy to parallelize calculations over and well-defined under traditional financial models.
One major question we examined was whether the graphs we encounter contain a reasonable number of paths. Technically speaking, a graph with cycles contains an infinite number of paths, but even acyclic graphs might contain a combinatorially large number. Cyclic graphs are an interesting thought experiment; one can imagine holding companies or legal entities that fractionally own each other. We devised a number of extensions to our system to handle this problem (reconsidering graph-based analysis, limiting the number of paths as an approximation), but upon examining our data, we found that these cycles did not occur in practice. Why introduce extra complexity for a problem that doesn’t exist? Similarly, we’ve found that the large path counts possibly resulting from dense, acyclic graphs also do not occur. While our graphs contain plenty of undirected cycles, most of these occur lower in the graph structure, meaning that the combinatorial explosion doesn’t happen. With these concerns aside, we have been able to leverage paths as a versatile, yet computationally tractable unit in our calculations.
Future Direction
The Financial Graph enables Addepar to model the financial world in a powerful and flexible way. Most importantly, it provides the basis for a common language that can describe the world’s financial workings. We can see the current Financial Graph as the beginning of a Global Financial Graph, which models every asset, asset owner and ownership relationship in the world. A complete understanding of the world’s financial data can help banks and financial institutions communicate more clearly with one another while enabling new levels of efficiency and transparency.
From another perspective, the Financial Graph is also incomplete — it models only ownership structure and holding details. Given that we’ve invested the legwork to support a graph-based model, we might wonder what other data we can model. We could retrofit the edges in our graph with other data: for example, we can assign social responsibility and impact scores so that a user might understand and optimize the effects of their investment from this perspective. Alternatively, we could retrofit the nodes in our graph with new edges entirely, modeling other ways in which investments and legal entities are related to provide a form of scenario analysis. These are just a few of the possibilities we’re exploring.
We are incredibly excited about the opportunities our Financial Graph provides us. If you would like to learn more or have some interesting ideas on how it might be used, reach out to your account manager or let us know at inquiries@addepar.com.