
Published on
Views and reports offer an incredibly flexible way to filter, group by and analyze your portfolio data. You can select from our wealth of built-in attributes (including a vast library of performance metrics and financial analytics), or build your own using custom attributes. Attributes and views are highly configurable and can be combined in creative ways to produce many different types of analysis.
Unfortunately, this flexibility can come with unpredictable performance at the largest enterprise scales. Our architecture is built to optimize, manage and efficiently execute the portfolio queries behind views and reports, but the work of these systems does not translate in an obvious way to end users. Sometimes, seemingly insignificant configuration changes can impact view runtime by an order of magnitude. Attribute runtime can vary considerably, and it can be hard to know for users where time is being spent. Additionally, total view runtime generally scales proportionally with data size, but the precise data sizes being processed within a view may not be clear.
In this post, we will briefly describe the execution model of portfolio queries to provide some intuition about their runtime. Additionally, we are excited to introduce existing and planned infrastructure and API features that will allow for more performant and predictable view execution, as well as providing increased transparency into query execution itself. These transparency features are analogous to a MySQL Explain of our underlying portfolio queries, because oftentimes the best way to debug query performance is to transparently look into its execution. We emphasize that the SQL query comparisons are only an analogy; execution is actually performed by our calculation subsystem which is not a DBMS.
This post will be of most interest to developers and technical staff at enterprise firms who are looking to build ETL and workflows to analyze data on our platform, but should also be generally interesting to those who are curious about fintech, computation or API design.
Portfolio Query Execution Model
We find that an SQL analogy works well to describe the execution of portfolio queries. Views and reports, and their underlying portfolio queries, each contain a set of filtering, grouping and column attributes. These attributes are executed against “rows” of portfolio data known as paths that are generated from the Financial Graph. The execution sequence is as follows:
Graph Walk - Traverse the financial graph associated with the selected portfolio and generate all unique ownership paths in the graph (see Figure 1). These paths reflect each position in the portfolio and its ownership information, and are equivalent to rows in the SQL analogy.
Filter - Apply the specified filter attributes to each path, retaining only paths that match each filter predicate. Note that this reduces the number of paths considered by the rest of the query. Filters may be reordered internally if it does not impact results and is likely to improve performance. Filtering is similar to an SQL WHERE statement.
Grouping - Apply each grouping attribute to each remaining filtered path. This produces a set of nested groupings, modeled as a tree structure, with one layer per grouping attribute. Each grouping still references the filtered paths that fall into that grouping. This is similar to a GROUP BY over multiple values in SQL.
Columns - Apply each column attribute to the filtered paths associated with each grouping in the tree structure. This produces the final portfolio query result (Figure 2). This is similar to having aggregated columns in an SQL SELECT with GROUP BY.
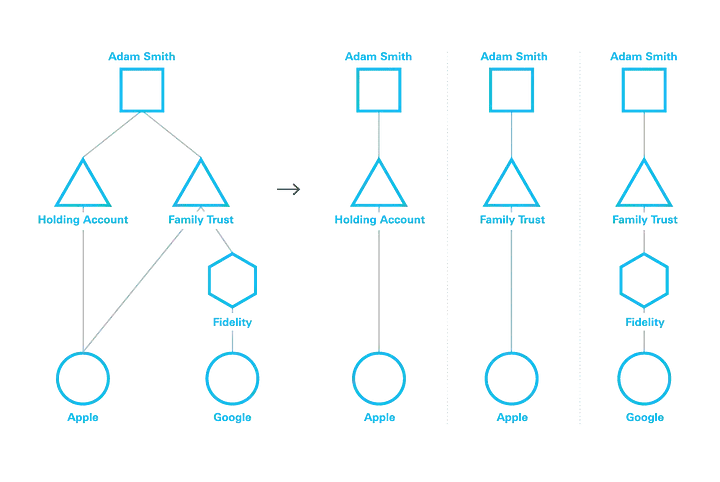
Figure 1: Sample output of a Graph Walk producing 3 paths
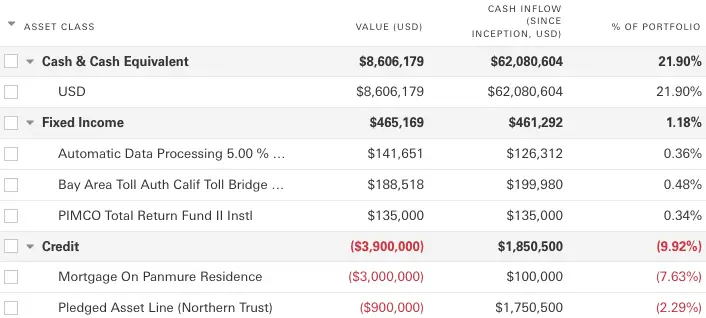
Figure 2: A portfolio query result showing groupings and columns
Of utmost importance for performance is the number of paths processed by each step. This is determined by two factors - the number of paths generated by the Graph Walk for the selected portfolio, and the number of paths remaining after applying the filters. Since the attributes used for Grouping and Columns tend to be more complicated than the attributes used for Filtering, a reasonable model for approximating portfolio query runtime is the size of the post-filtering portfolio multiplied by the total complexity of Grouping and Column attributes. This model should provide some intuition for understanding how some of our compute platform features and optimizations work.
Existing Features for Efficient and Reliable Performance
First and foremost, we recommend the use of the v1 APIs when running portfolio views at scale. These APIs are ideal for ETL, MS Excel export and high row count views since they are not subject to in-product view result limitations or the need to keep the browser tab open.
Critically, the async variants of these APIs, known as the Jobs APIs, allow for asynchronous execution of the underlying portfolio queries, which provides durability and retries for high availability. Queries running asynchronously are not liable to be lost due to connection instability or browsers resting, and Addepar has more flexibility to tune and scale the servers on which requests are run. Additionally, since the async APIs use our underlying scheduling and job state management system, your jobs will benefit from our ongoing improvements to the performance and reliability of these systems.
One such improvement that we’re very excited about is Batched Jobs, whose execution splits large views into smaller chunks, provided the view follows certain rules. This allows us to schedule execution of these chunks concurrently and permits us to scale applicable resources horizontally. This feature has provided beta clients with 3-5x runtime improvements and is in the process of being rolled out more widely.
Essential features for performance are not limited to the APIs. Scheduled views provide the ability to pre-run views at scheduled times so that they load instantly, at a desired data version, in the product. Scheduled views are useful for streamlining in-product workflows involving multiple large scale views and locking in data at a particular “as of date” for later analysis.
Lastly, we want to emphasize careful filter configuration for improving portfolio query performance in the APIs and the product alike. Ownership filters, which filter on ownership or entity criteria like Top Level Owner, Holding Account, Position or Security, allow us to essentially skip the first two steps in portfolio query execution (Graph Walk and Filtering) by letting us begin analysis directly from the filtered entities. We are most often able to apply this optimization when ownership filters are specified first, so be sure to configure views in this way when applicable. Other filters that may improve performance without significantly impacting workflow functionality are rank filters (e.g., top N), and hide previous holdings, both of which reduce the amount of data in the post-filtering steps.
Upcoming Features that Provide Transparency
Ultimately, there is no substitute for actually running and testing the views that back your ETL or portfolio analysis workflows. We have been planning several API features that provide transparency into portfolio query execution to help you configure and sustainably operate large scale portfolio views. These features help you dive deeper into query execution to more precisely identify potential issues. As a disclaimer, we are discussing features that are not yet targeting a release but are under active consideration by engineering teams.
Execution Info API
This API would optionally include detailed query execution information in the portfolio query API result. The information falls under two categories:
Data size - Return the number of paths processed during portfolio query execution, both pre and post-filtering
Attribute runtime - Return the amount of time spent running each attribute during the filtering, grouping, and column execution stages
An example response might look like the following:
...
"execution_info": {
  "data_size": {
    "pre_filter_paths": 2513920,
    "post_filter_paths": 8483
  },
  "attribute_runtimes": [
    {
      "name": "Custom Asset Class",
      "id": 141913828,
      "type": "FILTER"
      "runtime_ms": 41039
    },
    {
      "name": "Security",
      "id": 970078276,
      "type": "GROUPING"
      "runtime_ms": 196
    },
    {
      "name": "Std Dev (USD)",
      "id": 156799706,
      "type": "COLUMN"
      "runtime_ms": 439
    }
  ]
}
...
This example shows that the majority of the runtime was taken up by the Custom Asset Class attribute being used as a filter. We also see that the pre-filter data size is considerable, meaning that data size is mostly responsible for the high runtime. We might improve this portfolio query by investigating the configuration of the Custom Asset Class to make it more performant, or by inserting additional filters (such as ownership or rank filters) to reduce the data size before the Custom Asset Class filter is applied.
Run History API
The Run History API is designed to help you monitor and operate views to ensure they are performant. It provides information about historical execution of the view, alongside its version (to track configuration changes), and result.
An example response follows:
...
"run_history": [
  {
    "timestamp": "2023-05-14T22:18:30",
    "runtime_ms": 34294,
    "version": 4,
    "status": "SUCCESS"
  },
  {
    "timestamp": "2023-05-21T22:21:49",
    "runtime_ms": 29844,
    "version": 4,
    "status": "SUCCESS"
  },
  {
    "timestamp": "2023-05-28T22:15:02",
    "runtime_ms": 210293,
    "version": 5,
    "status": "SUCCESS"
  },
  {
    "timestamp": "2023-06-04T22:18:23",
    "runtime_ms": 184757,
    "version": 5,
    "status": "SUCCESS"
  }
]
This example shows a performance degradation on 5/28 which accompanied a version change. We can infer that the performance difference was due to the configuration change that occurred on that day and can investigate further by using the audit trail or the execution info API.
Conclusion
Addepar’s portfolio query system offers a unique combination of flexibility and performance that enables many analysis workflows at nearly all scales. However, at the largest scales, performance can become a consideration, and workflows may require some degree of data engineering and tuning. We’ve offered an SQL-based analogy for understanding the factors influencing portfolio query performance, and have provided some best practices for utilizing our existing platform features to build reliable, performant workflows, particularly our async APIs. We’ve also presented information on planned future APIs that will allow users to build more interactively and with a deeper understanding of how queries execute on the platform. We look forward to working more with users to provide the most powerful operating platform for finance in the industry.
Learn more about developing with Addepar via our Developer Portal, and check out our existing documentation on portfolio views and the jobs API.